SUPER LEAGUE has been through some tough times in recent years following the Covid-19 pandemic.
Attendances were down as finances suffered – the effects of which are still being felt heading into 2023.
That being said, a number of Super League clubs have actually improved their appeal for fans, increasing their attendances from pre-Covid levels.
Here are the statistics for those 12 clubs that took to the top flight in 2022.
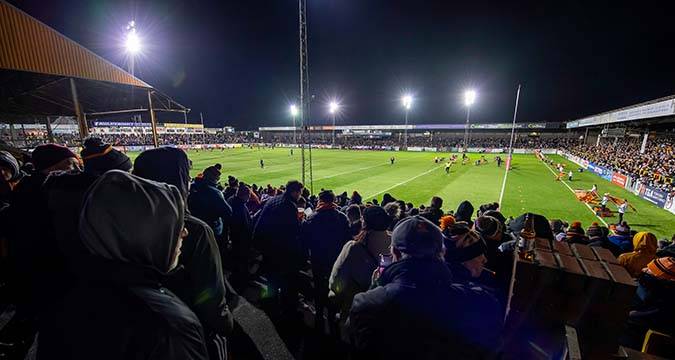
Castleford Tigers
Best – v Hull FC (SL – 10,072)
Worst – v Huddersfield Giants (SL) – 5,672
Total (SL only) – 97,608
Average (SL only) – 7,508 (up by 255 in 2019)
Catalans Dragons
Best – v St Helens (SL – 10,260)
Worst – v Featherstone Rovers (CC – 3,624)
Total (SL inc. play-offs) – 114,408
Average (SL, inc. play-offs) – 8,172 (down by 446 in 2019)
Huddersfield Giants
Best – v Leeds Rhinos (SL – 6,712)
Worst – v Hull FC (CC – 3,637)
Total (SL, inc. play-offs) – 73,258
Average (SL, inc. play-offs) – 5,233 (up by 7 in 2019)
Hull FC
Best – v Hull KR (SL – 16,999)
Worst – v Toulouse Olympique (SL – 8,785)
Total (SL only) – 139,923
Average (SL only) – 10,763 (down by 715 in 2019)
Hull KR
Best – v Hull FC (SL – 10,300)
Worst – v Leigh Leopards (CC – 3,088)
Total (SL only) – 101,253
Average (SL only) – 7,789 (down by 431 in 2019)
Leeds Rhinos
Best – v Castleford Tigers (SL – 15,418)
Worst – v Castleford Tigers (CC – 5,112)
Total (SL only) – 168,232
Average (SL only) – 12,941 (up by 214 in 2019)
Salford Red Devils
Best – v St Helens (SL – 6,041)
Worst – v Catalans Dragons (SL – 3,204)
Total (SL only) – 60,310
Average (SL only) – 4,639 (up by 893 in 2019)
St Helens
Best – v Wigan Warriors (SL – 17,980)
Worst – v Wakefield Trinity (SL – 8,222)
Total (SL, inc. play-offs) – 166,550
Average (SL, inc. play-offs) – 11,896 (down by 14 in 2019)
Toulouse Olympique
Best – v Catalans Dragons (SL – 9,168)
Worst – v Castleford Tigers (SL – 3,326)
Total (SL only) – 64,582
Average (SL only) – 4,968 (up by 2,678 in 2019)
Wakefield Trinity
Best – v Wigan Warriors (SL – 7,046)
Worst – v Huddersfield Giants (SL – 3,166)
Total (SL only) – 60,241
Average (SL only) – 4,634 (down by 834 in 2019)
Warrington Wolves
Best – v St Helens (SL – 10,476)
Worst – v Wakefield Trinity (CC – 2,627)
Total (SL only) – 113,377
Average (SL only) – 8,721 (down by 1,927 in 2019)
Wigan Warriors
Best – v St Helens (SL – 19,210)
Worst – v Salford Red Devils (CC – 6,005)
Total (SL, inc. play-offs) – 172,400
Average (SL, inc. play-offs) – 12,314 (up by 882 in 2019)